
ELT Spectrograph Design Project
WP2: Literature Research
The goal of this workpackage was to do general research about Quasars in general and the Lyman α forest in particular. This should provide the theoretical background knowledge necessary for the project. By doing extensive research on the field and reading associated literature, we would be able to provide information required for the instrument design and answer questions one might have about the astrophysical aspects of the project.
General Information
The focus of this course lies on the lyman alpha forest and its origin. Therefore, a short explanation is provided, starting at the birth of the photon and ending at the observation here on earth.
Quasar
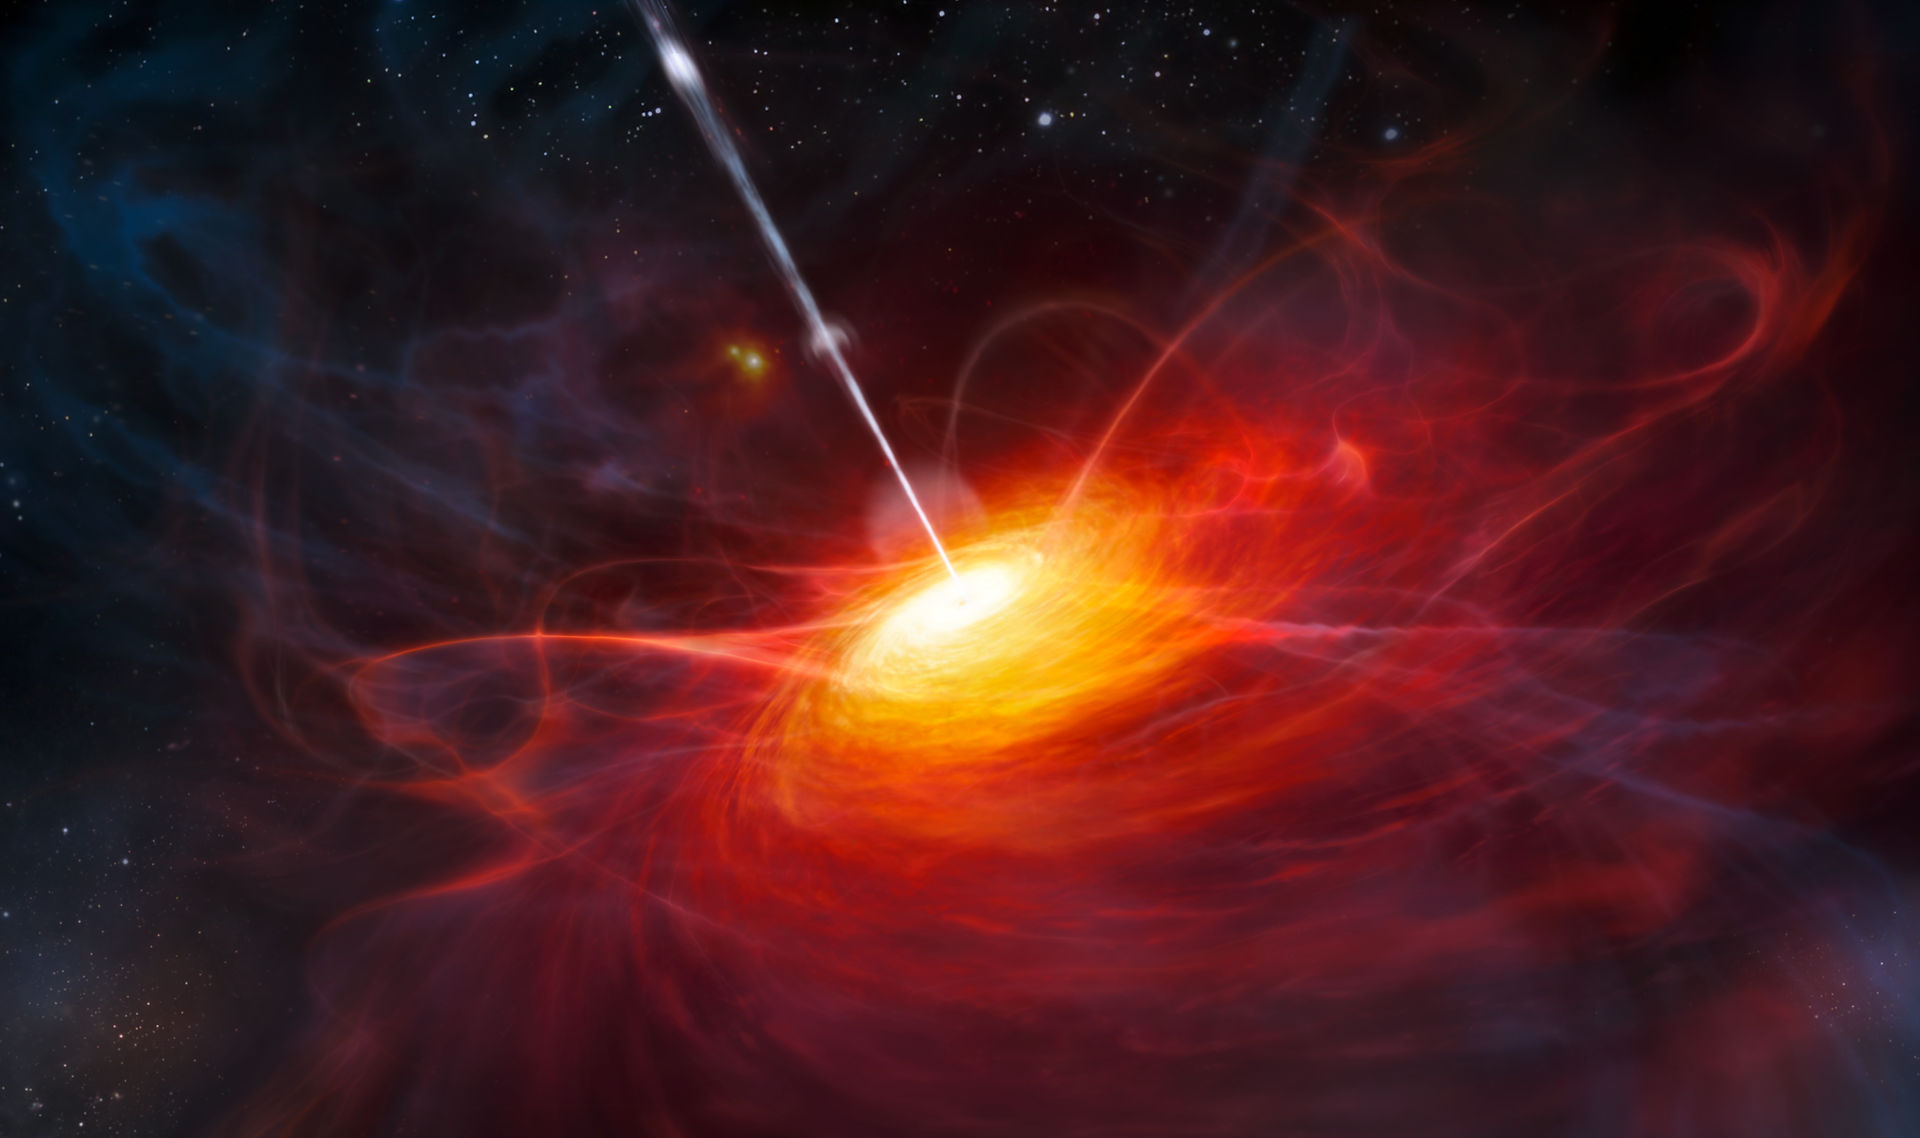
The photon's journey starts at a quasar, a quasi-stellar radio source[14]. It consists of a black hole in the center and an accretion disk orbiting said black hole[14]. Particle interactions in the accretion disk result in large temperatures, which emit light due to thermal emissions. The particle interactions are more violent at the center, resulting in higher temperatures and more light emission. The accretion disk orbits the black hole, meaning that some sections of the quasar are moving towards the observer, while others are moving away, resulting in a broad and smooth emission spectrum, due to the doppler effect. This broad and smooth emission spectrum and their high brightness[14] make quasars interesting objects for research.
Cosmological Redshift
As a result of the expansion of the universe, the distance between two objects in space is ever increasing, even without relative velocities. This results in a redshifting, a lengthening of the waves, of electromagnetic radiation. This was speculated when a roughly linear connection between the redshift of galaxies and their distance was observed[16].
This process is continuous, meaning that for every small time step, space stretches by a small amount. This results in a continuous redshifting on the spectrum emitted by the quasar.
Absorption by hydrogen clouds
The light emitted by the quasar encounters gaseous hydrogen clouds on its trip to earth, meaning that at every redshift, an absorption could occur. The amount of absorption depends on the size and density of the clouds, resulting in different absorption lines in the spectrum but through the cosmological redshift, the absorption lines are also shifted further into the low energy regions, therefore moving the previous absorption lines away. This results in many absorption lines at different places in the spectrum, giving the spectrum the look of a forest, where its name also stems from.
Earth interaction
Once the light reaches earth, certain parts of the spectrum are absorbed by earth's atmosphere. Luckily, the absorption spectrum of the atmosphere is well known. Now, the light can be measured using the instrument of choice and analyzed.

Simplified example of the origin of the Lyman Alpha Forest. The radiation source, the quasar, is located at the top right corner, while the observer is in the bottom left. The radiation is shown as a transversal wave, while the color changes from blue to red, as the light approaches the observer. This shows the cosmological redshift. In the center is a galaxy and a gas cloud, symbolizing the absorption interactions the light has. [13]
Theoretical Background
"The Lyman alpha forest is an absorption phenomenon seen in the spectra of high redshift QSOs and galaxies. It is the only direct observational evidence we have of the existence and properties of the general Intergalactic Medium, and, as we have reason to believe, of most of the baryonic matter contents of the universe." [1] The Lyman alpha forest or Lyα forest is formed when the light of a distant bright QSO passes intergalactic gas clouds (and sometimes gas associated with foreground galaxies). Part of the light is absorbed by the gas, the gas cloud thereby modifies the spectrum of the light and leaves an imprint of information about its physical and chemical state. The most common absorption process defining the spectrum is the one corresponding to the Lyman α line of neutral hydrogen: "The name 'Lyman α forest' refers to the appearance of the optical QSO spectra, which show a forest of hundreds of sharp absorption lines, mostly of neutral hydrogen Lyman α line, superimposed on the more smoothly varying QSO continuum. Almost all the lines in the Lyman α forest correspond to the same atomic transition (which at λ = 1215.67 Å = 121.567 nm is in the ultraviolet wavelength region)." [1] The dense “forest” of lines is formed when the central wavelength of the Lyα absorption line at 1215.67 Å is shifted to longer wavelengths due to the cosmological expansion of space. Since the amount of redshift depends on the traveled distance, the wavelength to which the absorption line has been shifted corresponds to the absorbing object’s position in space. [2] The video below is a good, though very rudimentary, illustration of how the Lyα forest forms in the spectra of QSOs due to absorption in intergalactic clouds of neutral hydrogen. It was created by Andrew Pontzen from the Department of Mathematical and Physical Sciences at UCL. [3]
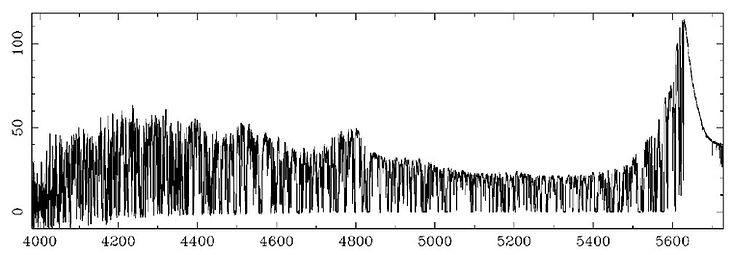
Exemplary spectrum of a QSO. The spectrum of this object QSO1422+23 with a typical redshift of z = 3.62 was observed with the High Resolution Spectrograph (HIRES) at the Keck observatory with an average signal-to-noise ratio of ~150 (from [4]).
The Gunn-Peterson Effect
Gunn and Peterson first predicted the Lyα forest absorption lines in QSO spectra in 1965. [3] The assumption was that as the further one looks back in the time of the universe, the more of the baryonic mass must have been present in gaseous form and since the Lyα line, the basic absorption lines of neutral hydrogen, the most common element in the universe, is rather large, the redshifted Lyα lines should dominate the spectrum of any bright light source with an approximately continuous spectrum, especially those of QSOs. They predicted that such a spectrum would present an absorption trough formed by individual Lyα lines blueward of the Lyα transition at 1215.67 Å. Such a characteristic absorption pattern is therefore referred to as the Gunn-Peterson effect. [1,3,4] Only later with higher resolution instruments was it possible to study the individual absorption lines.
The Proximity Effect
In 1981 Weymann et al first described the apparent lack of Lyα absorption lines in the observed spectra created in close proximity to the respective QSO, which they attributed to increased ionization of hydrogen clouds in the vicinity of the QSO. [5,6] If the cause is in fact the QSO’s radiation field, this phenomenon, generally called proximity effect though sometimes also inverse effect, provides a measure of the intensity of UV background radiation dependent on the distance from the QSO based on the density of lines in the object’s spectrum. This method is based on the process of finding the ratio between the intensity of the UV background in the region and the ionizing flux of the QSO by observing the change in the abundance of neutral hydrogen with increasing distance and was first used in 1987 by Carswell et al. [7] Since then the method was applied to increasingly larger numbers of QSOs, though the results still carry large uncertainties. Additionally, other explanations for the cause of the proximity effect exist, such as the high pressure close to the QSO inhibiting the neutral gas absorption. [4]
Quasar
Quasars are a special type of astronomical objects, which consist of a black hole in the center and an accretion disk, composed of various gasses, orbiting it. The name Quasar is an abbreviation for the phrase “quasi-stellar radio source”[14]. Technically, this means quasars are only quasars if their measured spectrum lies in the radio frequencies. For non radio emitting quasars there is the abbreviation “QSO”, but they are usually grouped into the same category under the term quasar.
They were first discovered in 1950[14] and are of interest because of their broad and smooth emission spectrum and their enormous brightness[14].
Temperature Gradient
The accretion disk shows harshly different orbiting intervals depending on the orbital radius due to the high gravitational acceleration by the black hole. This results in different orbital velocities, which leads to increasingly violent particle interactions as the orbit decreases. This slows some particles down, reducing their orbital radius, while transferring their energy to other particles, partially in kinetic energy but also in thermal. Therefore, the temperature of the gasses increases as the orbital radius decreases. This leads to a higher emission rate in the center parts of the accretion disk.
Usually, Quasars are observed for their entire emission spectrum, therefore a differentiation between certain parts of the accretion disk are not made, so the emission spectra of every orbital radii are added, resulting in an unusually broad spectrum.
Doppler Effect
As stated before, the accretion disk is orbiting the black hole. This means, assuming that the disk is circular and gaps exist, that one part of the accretion disk is always moving towards an observer and one part is moving away. This results in the doppler effect affecting the emission spectrum, shifting the emissions of the section moving towards the observer further into the blue region, while shifting the sections moving aways further into the red regions. This has the effect that the emission spectrum is further broadent, but also smoothed out.
Cosmological Redshift
The cosmological redshift, also called Hubble Redshift[16], was first observed in the 1920s, when an approximately linear relationship between the distance of a galaxy and its redshift was measured. The redshift of an interstellar object can be expressed as the redshift z. The redshift z can be measured as follows:

where z is the redshift, lambda_e is the emitted wavelength and lambda_o is the observed wavelength. This equation only uses the measured and expected values into consideration, glossing over a lot of theory. As the redshift stems from the expansion of the universe, there is also a correlation between the redshift of the wave and the expanded universe:
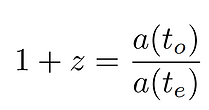
where a describes the time dependent cosmic scale factor and t_o is the time of observation and t_e is the time at emission[15]. Therefore, the redshift is dependent on the traveltime of the light and also the distance between the emitter and observer.
In order to calculate the size of the universe at two points in time, an expression for the cosmic scale factor would need to be derived. This requires insight into relativity and into the nature of our universe, which are beyond our scope at the moment.
Shape of Absorption Lines
Since all lines in the Lyα forest originate from the same energy transition of the Lyman α line, they share their basic characteristics. Generally, the shape of the absorption lines can most accurately be described by a Voigt profile, which is the convolution of a Lorentz profile for the line width and a Maxwellian velocity distribution, however, a description with a Gaussian profile is sufficient for most applications. [4]
Lorentz Profile for Natural Line Width
The natural linewidth of the individual absorption lines is given by a Lorentz profile because the probability for a hydrogen atom to absorb a photon with a specific frequency is defined by a Lorentzian probability distribution centered around the frequency corresponding to the atomic energy level transition (in this case the Lyman Alpha transition), given by
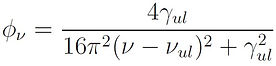
Where the γ is the damping width for the upper energy level, ν is the photon’s energy, and the ν with the subscript 'ul' is the frequency of the resonance line. [4,9]
Different shapes of Lyα absorption lines. The shape gets narrower with increasing column density of the absorbing hydrogen cloud (from [2]).
Maxwellian Velocity Distribution
The Maxwellian velocity distribution describes the range of velocities of the hydrogen atoms causing the absorption due to the variation in the thermal and kinetic velocity of the clouds of hydrogen gas. This velocity distribution is defined as

The b-value consisting of both thermal and kinematic components determines the shape of the velocity distribution. [4,9]

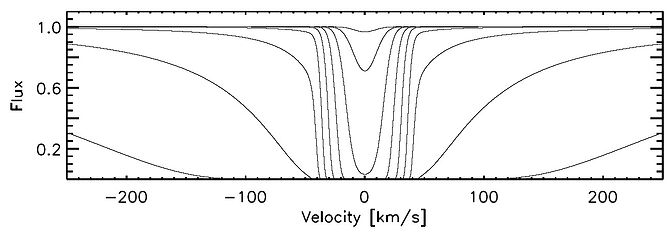
Change in absorption line shape for different b-values and column densities N(HI). An increase in the b-value widens the line profile. It is also notable that the influence of the b-value decreases with increasing column densities (from [2]).
Voigt Profile
The final Voigt profile describing the absorption line shape is, as mentioned above, the convolution of the Lorentz profile of the natural line width and the Maxwellian velocity distribution. When the absorber producing the individual absorption line is in fact a gas cloud with a Gaussian velocity dispersion, the Voigt profile can provide an exact description of the line shape. [4,9,10] However, in many situations, an analytical solution to the Faddeeva function is not possible, therefore an approximation is used, in this case, the Preudo-Voigt approximation

where eta is the full width at half maximum function.
Influence of Object Density and Size
When looking at objects on an astrophysical scale, the size of the object influences the transformation performed by the object on the spectrum, due to the cosmological redshift. While a large object with low density may absorb the same amount of radiation when compared to a small object with a high density, the spectra look very different. The size of the object influences the width of the absorption line width, while the density influences the intensity of absorption. A large object with a low density will have a broad absorption line with a low amount of absorption, while a small dense object has a thin absorption line, with a high absorption.
Observation
"The method of choice for studying the Lyα forest is optical high-resolution spectroscopy, with a spectral resolution Δλ/λ > 30 000 sufficient to resolve Lyα lines thermally broadened by the photoionization heating from the UV background. With 8 m class telescopes, a spectrum of a QSO suitable for further analysis of the Lyα forest absorption can be obtained within a few hours of observing time." [1] Generally, the Lyα forest in the spectrum of a QSO can be observed with any spectroscope with sufficient spectral resolution and observing time. Since the red-shifted absorption lines are only present in the longer wavelengths, only the spectral region with wavelengths longer than the Lyα line at 1215.67 Å is of interest. Usually, it is preferable to observe QSOs with high redshift (z > 2) since it both increases the possible number of absorption lines separated by redshift and moves the part of the Lyα forest in the wavelength region of visible light, making the observation more accessible on the earth’s surface. [1,4]
Observational Constraints
The main constraints on the observation and study of the Lyα forest are the same as for any spectrography, the signal-to-noise ratio (SNR) and the spectral resolution. [1,4] For a long time, it proved too difficult to measure with a sufficient spectral resolution to distinguish individual absorption lines, necessitating a full width at half maximum (FWHM) of at least smaller than 10 km/s, while providing a sufficient SNR. [4] This difficulty long favored low-resolution analysis approaches based on the mean absorption of the transmitted flux, which were not reliant on a high spectral resolution and could be applied more easily to a large number of datasets. [11] A significant push forward of this boundary was the deployment of the 10-m Keck telescope with the High Resolution Spectrograph (HIRES) for the first time enabling high spectral resolution and signal-to-noise ratios in the order of 100. [12] Another constraining factor for the study of the Lyα forest is the wavelength range in which the spectrum can be observed, which is often limited to the visible part of the spectrum. This has long restricted the field to the study of the spectra of objects with larger redshift. And even though some specific instruments have so far been used to observe the Lyα forest in the UV spectrum, this remains a limiting factor. [1,4]
Absorption Profile Decomposition
While, as mentioned above, other analysis techniques for data with lower spectral resolution exist, here only the most commonly used technique for data with a high spectral resolution will be discussed. This technique is based on the process of decomposing the spectral data into the individual absorption line profiles. For a good overview of the most observational and analytical techniques and over the phenomenon in general, the review paper by Michael Rauch is recommended. [4]
The method of absorption profile decomposition, or more specifically Voigt profile decomposition, since the Voigt profile is usually used for the theoretical description of the absorption line profiles, is based on the assumption that the Lyα forest is composed of many redshifted absorption lines. In order to distinguish the individual lines, the baseline QSO spectrum is estimated with a polynomial fit of the spectral regions which are assumed to be free of absorption. This basic fit often has to be adjusted to correct effects introduced by the observational process. The individual absorption lines in the observed spectrum can then be identified and each fitted with a model description (usually with a Voigt profile). [4,9,10]
Recommended Reading
For a good basic understanding of the Lyman Alpha Forest, its discovery, working principle, and use in cosmology, the article on the phenomenon in the Encyclopedia of Astronomy [1] and the review paper by Michael Rauch from 1998 [4] are highly recommended.
References
[1] Rauch, M. and Murdin, P., 2006. Lyman Alpha Forest. Encyclopedia of Astronomy.
[2] Day, A., 2013. An Analysis of Astrophysics and Fundamental Physics from the Lyman-alpha Forest. University of California, San Diego.
[3] Gunn, J.E. and Peterson, B.A., 1965. On the Density of Neutral Hydrogen in Intergalactic Space. The Astrophysical Journal, 142, pp.1633-1636.
[4] Rauch, M., 1998. The Lyman alpha forest in the spectra of quasistellar objects. Annual Review of Astronomy and Astrophysics, 36(1), pp.267-316.
[5] Weymann, R.J., Carswell, R.F. and Smith, M.G., 1981. Absorption lines in the spectra of quasistellar objects. Annual Review of Astronomy and Astrophysics, 19(1), pp.41-76.
[6] Bajtlik, S., Duncan, R.C. and Ostriker, J.P., 1988. Quasar ionization of Lyman-alpha clouds-The proximity effect, a probe of the ultraviolet background at high redshift. The Astrophysical Journal, 327, pp.570-583.
[7] Carswell, R.F., Webb, J.K., Baldwin, J.A. and Atwood, B., 1987. High-redshift QSO absorbing clouds and the background ionizing source. The Astrophysical Journal, 319, pp.709-722.
[8] Gunn, J.E. and Peterson, B.A., 1965. On the Density of Neutral Hydrogen in Intergalactic Space. The Astrophysical Journal, 142, pp.1633-1636.
[9] Carswell, R.F., Morton, D.C., Smith, M.G., Stockton, A.N., Turnshek, D.A. and Weymann, R.J., 1984. The absorption line profiles in Q1101-264. The Astrophysical Journal, 278, pp.486-498.
[10] García, T.T., 2006. Voigt profile fitting to quasar absorption lines: an analytic approximation to the Voigt–Hjerting function. Monthly Notices of the Royal Astronomical Society, 369(4), pp.2025-2035.
[11] Oke, J.B. and Korycansky, D.G., 1982. Absolute spectrophotometry of very large redshift quasars. The Astrophysical Journal, 255, pp.11-19.
[12] Vogt, S.S., Allen, S.L., Bigelow, B.C., Bresee, L., Brown, W.E., Cantrall, T., Conrad, A., Couture, M., Delaney, C., Epps, H.W. and Hilyard, D., 1994, June. HIRES: the high-resolution echelle spectrometer on the Keck 10-m Telescope. In Instrumentation in Astronomy VIII (Vol. 2198, pp. 362-375). International Society for Optics and Photonics.
[13] Ting, Yuan-Sen, Harvard University, 2013, Lyman Alpha Forest.
[14] Peterson, Prof. Bradley, Department of Astronomy, The Ohio State University, Quasar.
[15] Chodorowski, Michał J., 2010, Copernicus Astronomical Center, The kinematic component of the cosmological redshift.
[16] R. Gray and J. Dunning-Davies, Department of Physics, University of Hull.